
| User Roles |  Admin Admin |  Staff contributor Staff contributor | ✗ External Contributor | ✗ Pulse user |
A period set is a saved configuration of period columns for a report. It determines which time periods and values are shown, so you can quickly switch between different views of the same report without rebuilding the column layout. This article explains what a period set is, how to create one, and which options are available in the period settings.
Table of contents
- What is a period set?
- How do I create a new period set?
- How do I rename an existing period set?
- Where do I find my period sets?
- How do I create period columns?
- What are the different options in the period selection?
- How do I use difference periods?
What is a period set?
A period set is a saved configuration of period columns for a report. It determines which time periods and values are shown, so you can quickly switch between different views of the same report without rebuilding the column layout.
Creating multiple period sets lets you switch instantly between views for different audiences or discussions, for example a two-year comparison versus a quarterly overview, without creating a new report.
Periods can be adjusted in custom report templates. Periods set up in report templates are always relative to the period you are currently viewing in a client file. For example, if you view a report in October 2022, values are shown relative to that date. If you view the same report in October 2023, values are shown relative to that date instead.
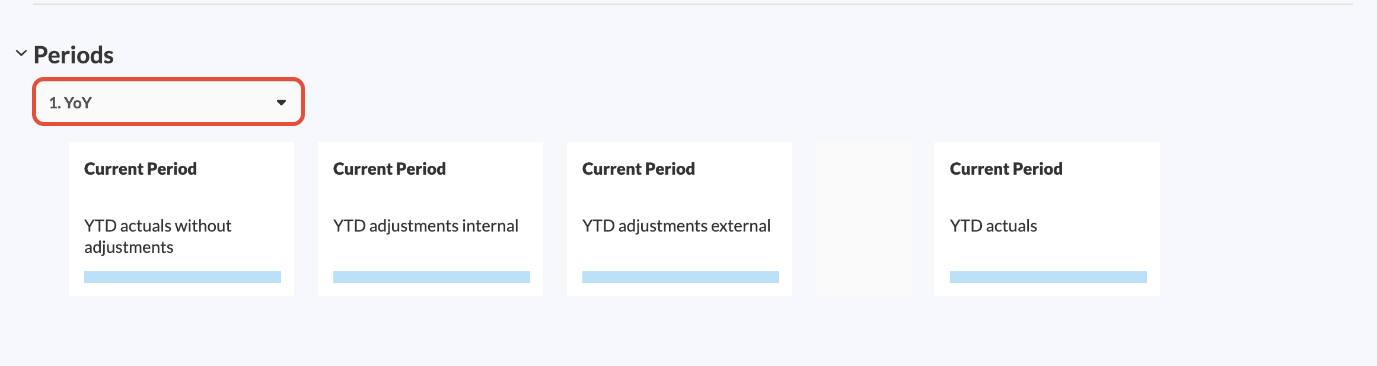
The dropdown menu in the Periods category shows the available period sets:
How do I create a new period set?
The steps depend on whether the report already uses period sets. Open the report at client file or firm level and check the top-left of the report:
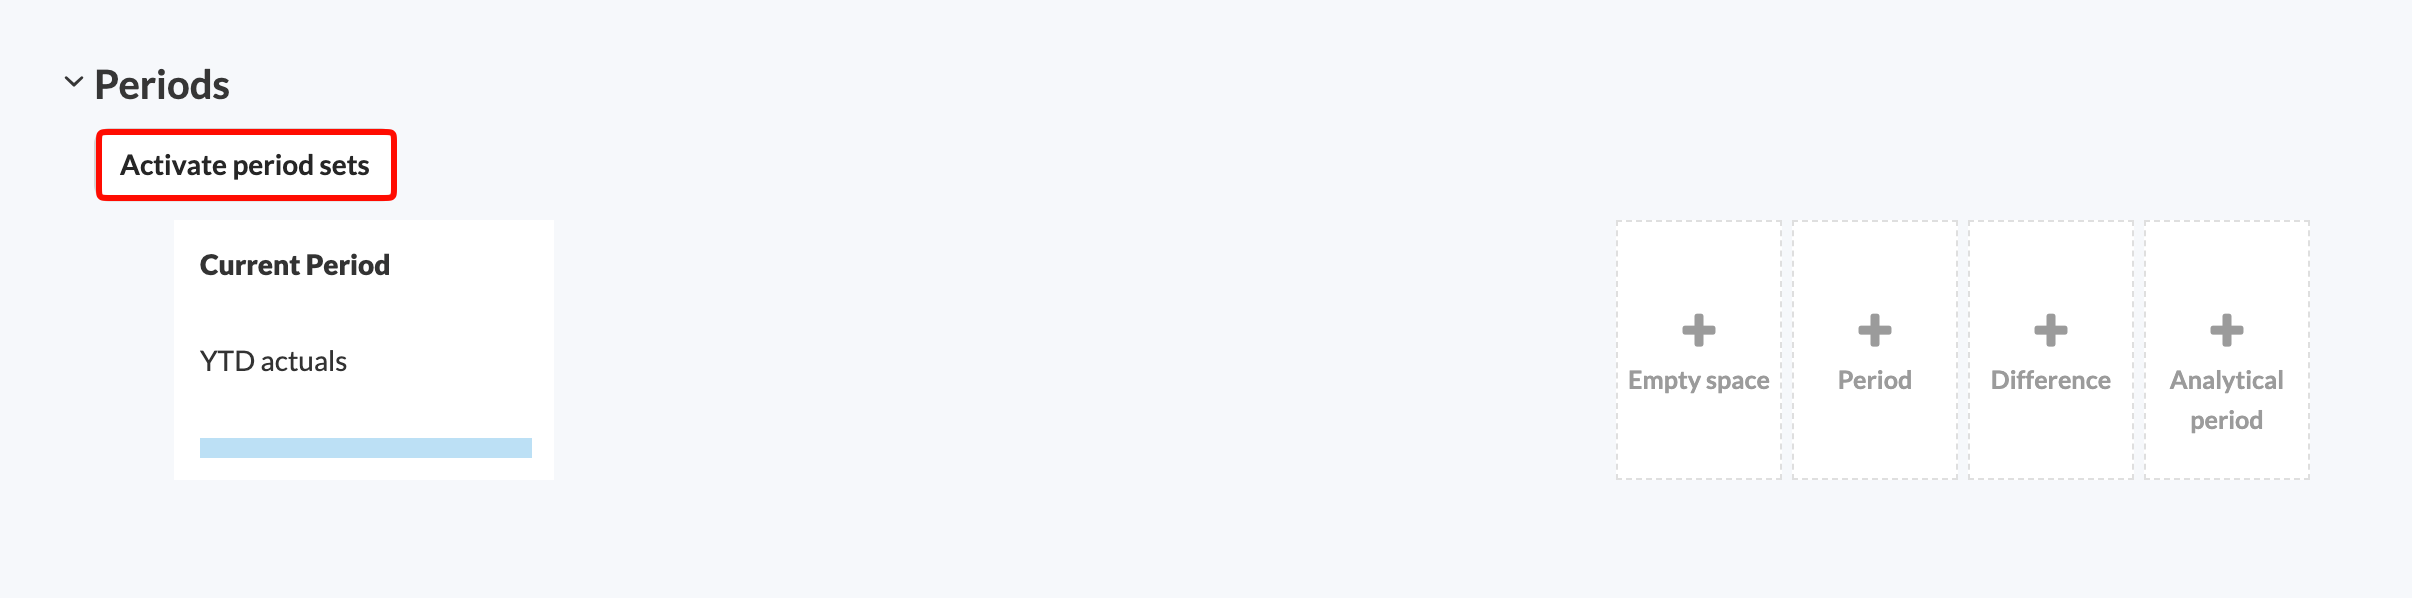
- If you see an Activate period sets option, the report does not use period sets yet. Follow My report does not use period sets yet.
- If you see a Periods dropdown menu, the report already uses period sets. Follow My report already uses period sets.
My report does not use period sets yet
- Click Activate period sets.
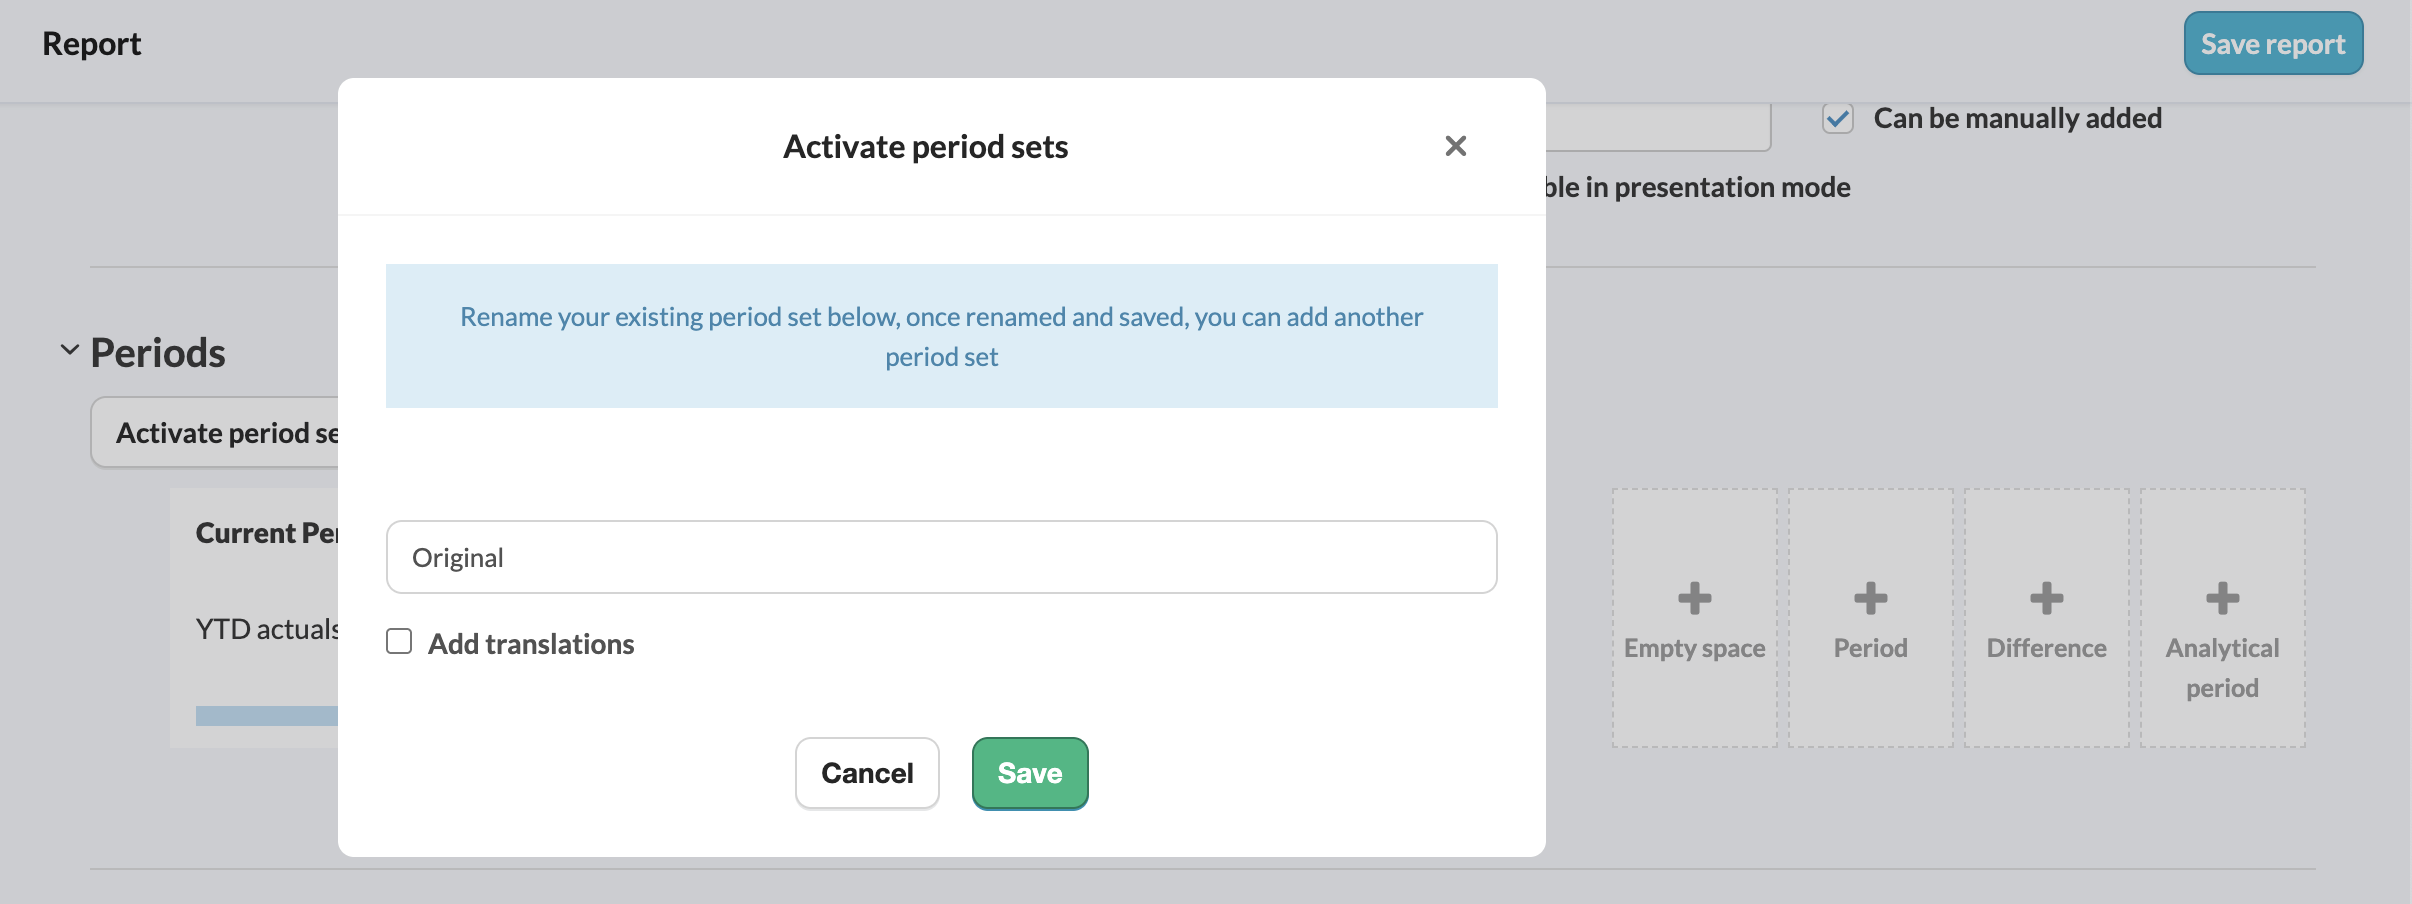
- Silverfin asks you to name the existing period, for example Original. Enter a name and click Save.
- The report now uses period sets. To add further sets, follow the steps in My report already uses period sets.
My report already uses period sets
- Click the Periods dropdown menu.
- Click Add period set.
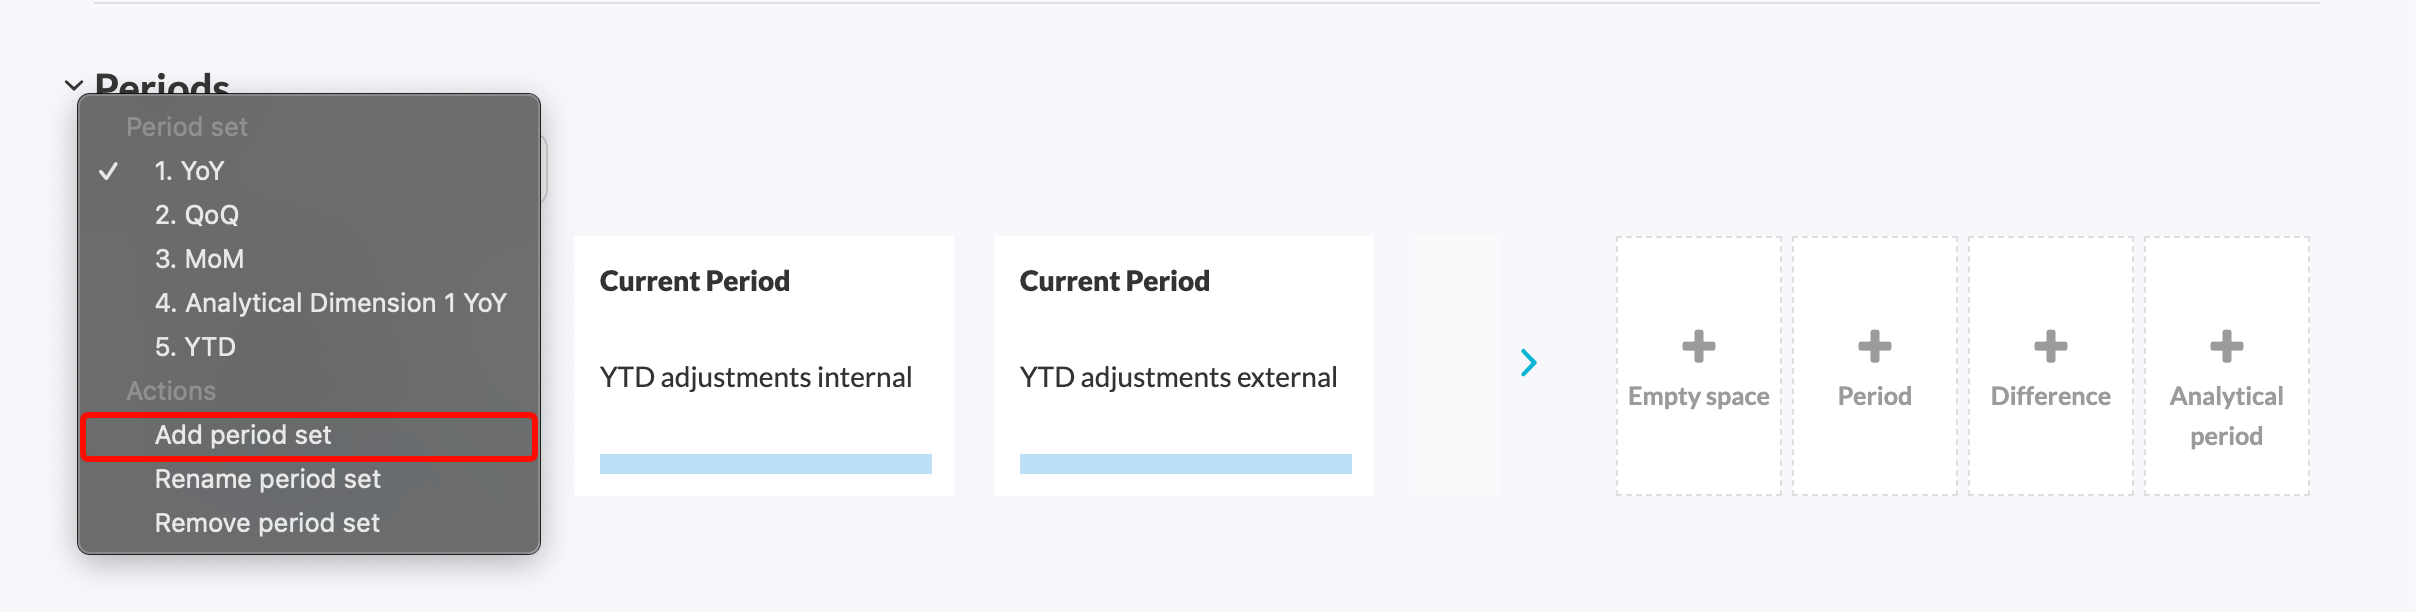
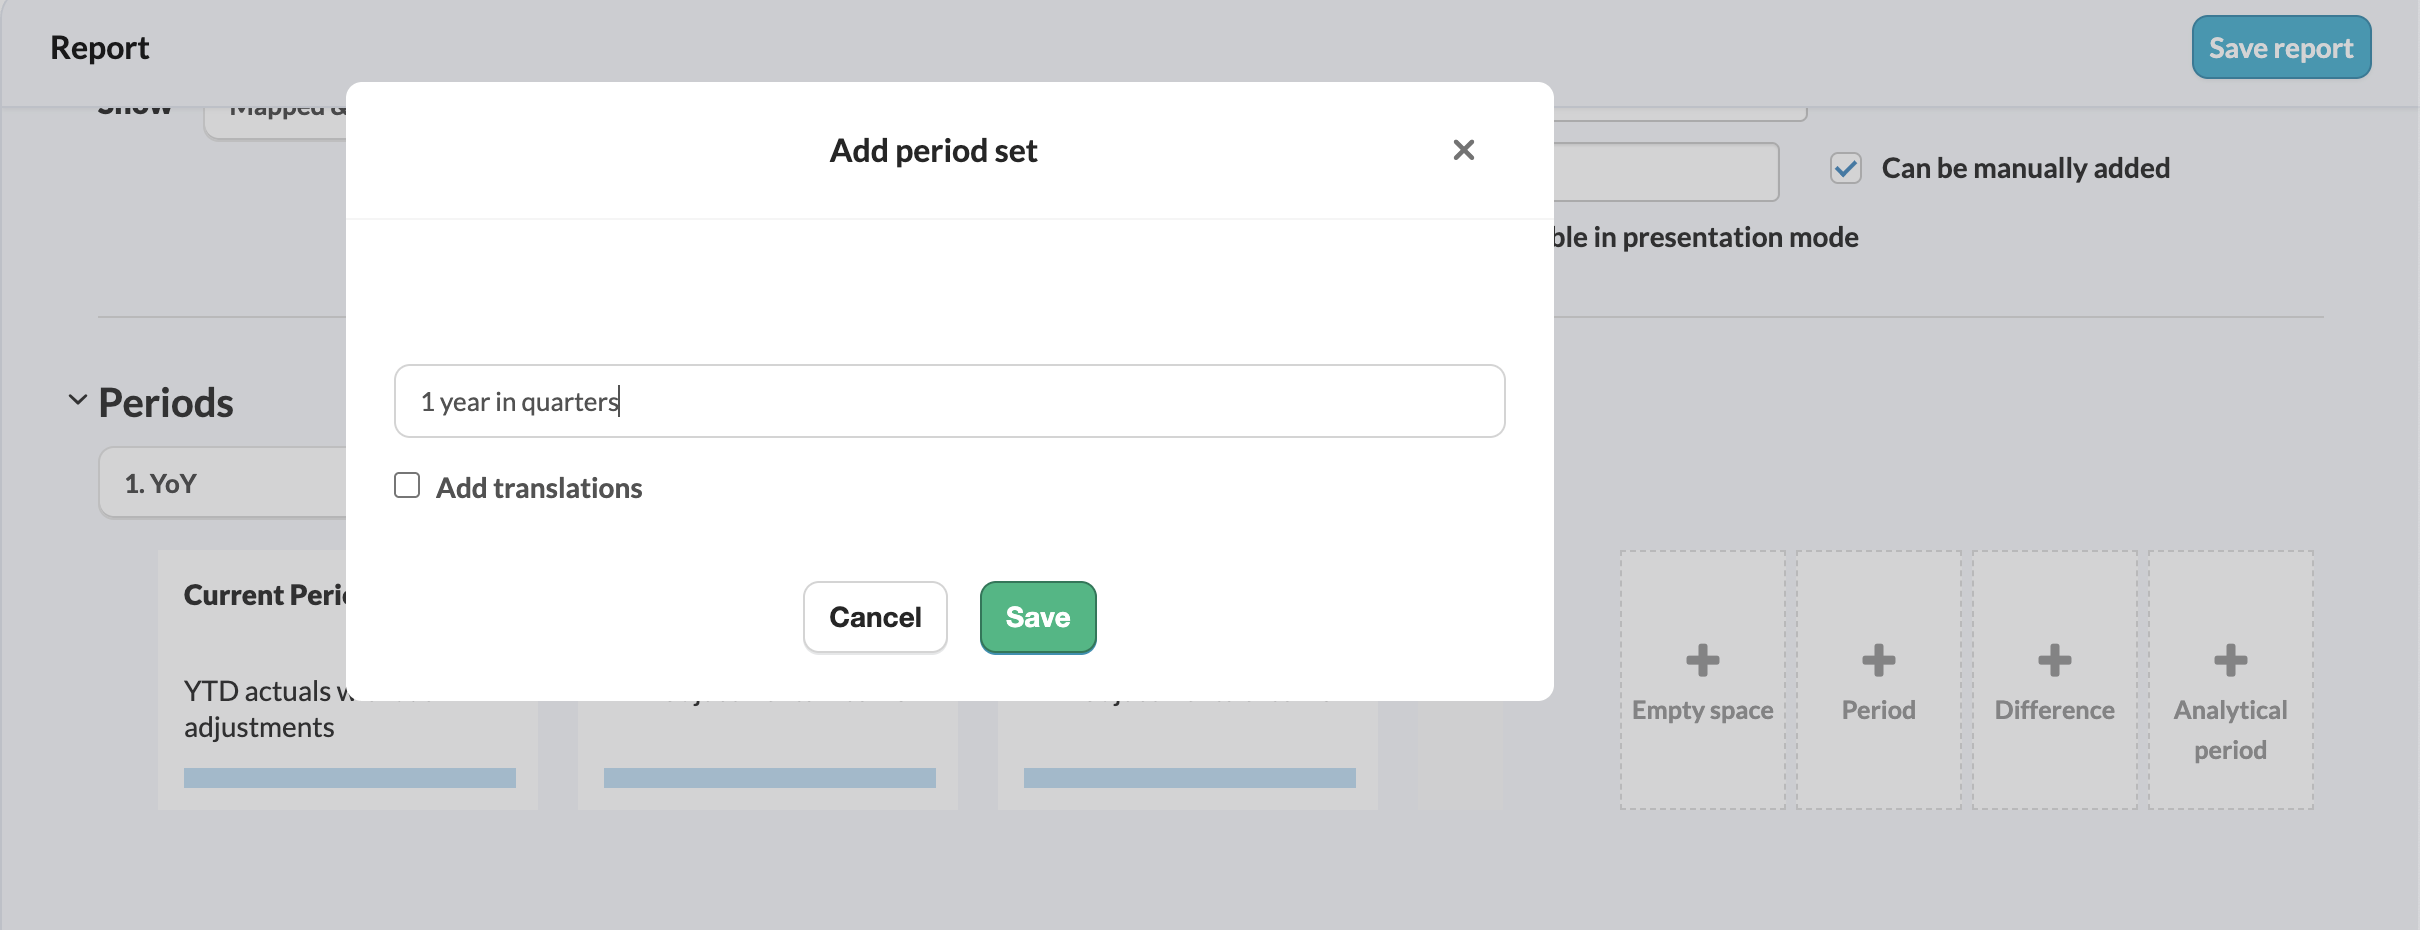
- In the pop-up window that appears, enter a suitable name, for example 1 year in quarters, and click Save.
How do I rename an existing period set?
- Go to the relevant report at client file or firm level.
- Open the Periods section from the report settings.
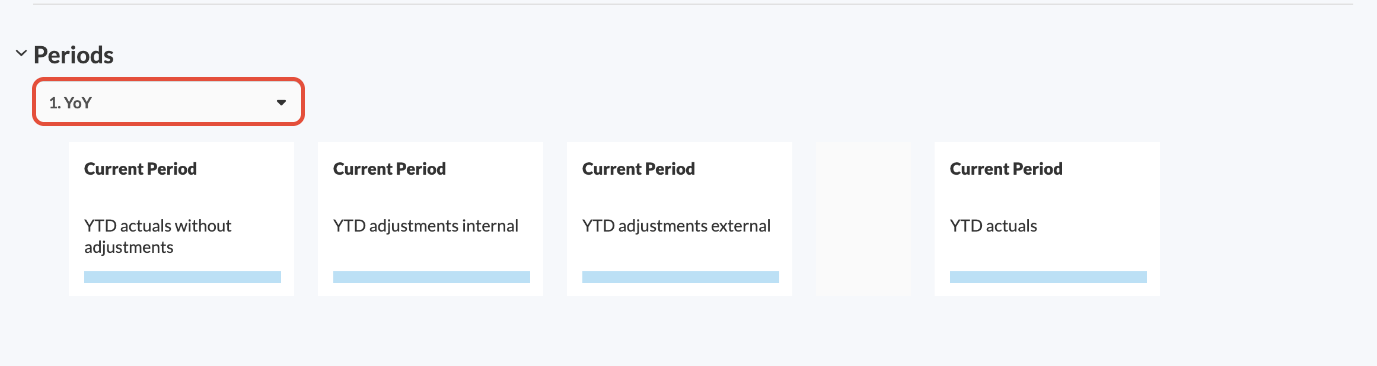
- Use the dropdown menu to select the period set you want to rename.
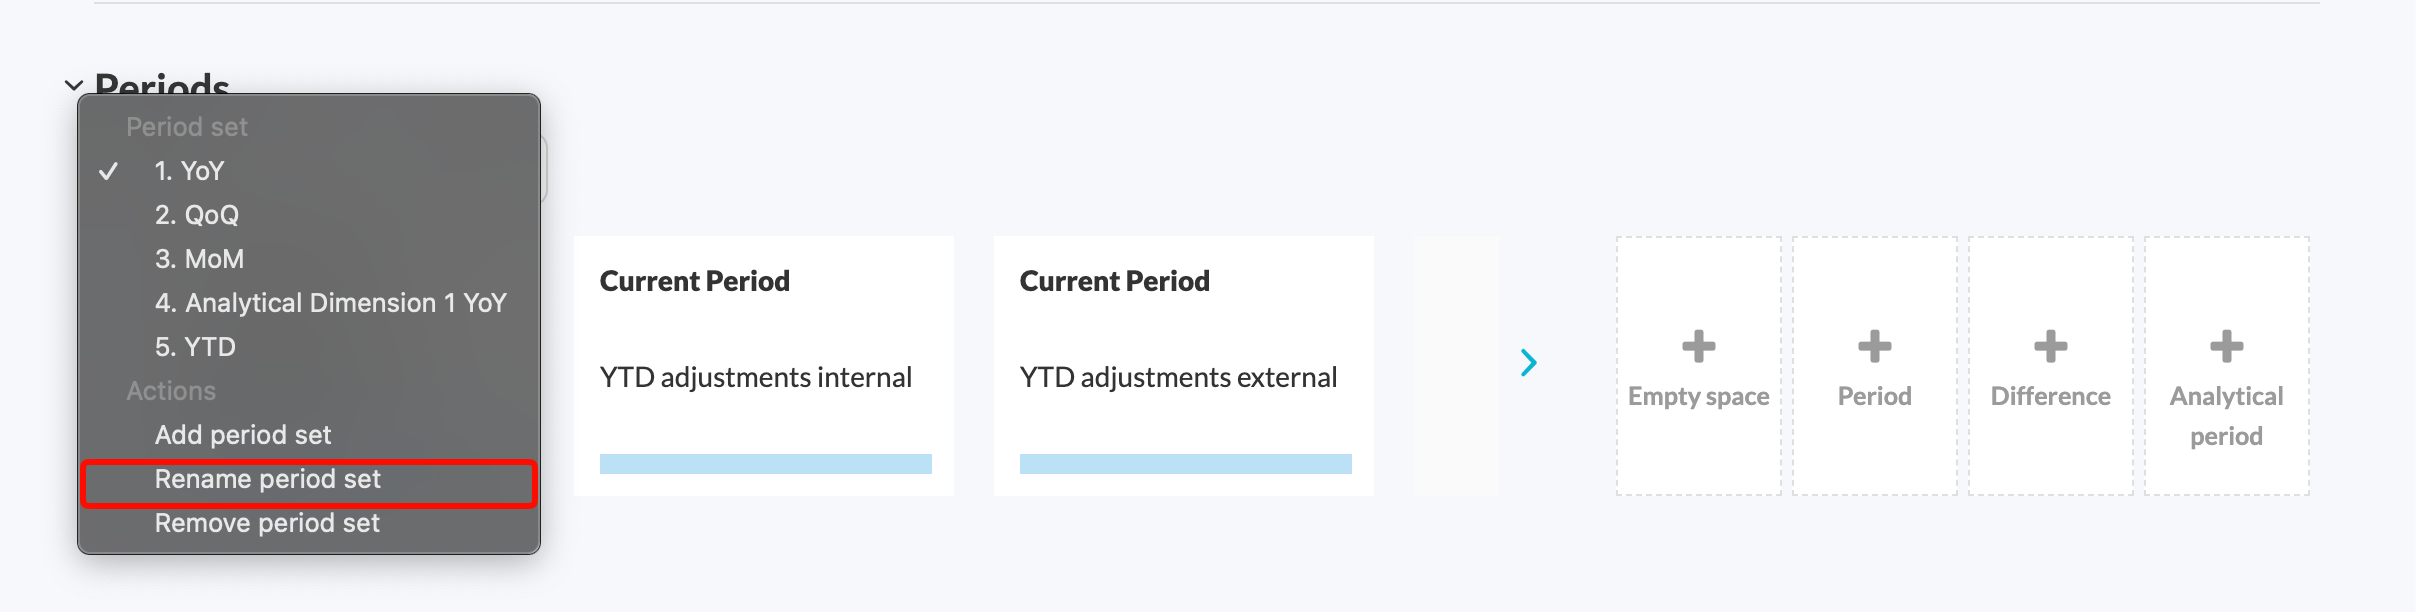
- Open the dropdown menu again and select Rename period set.
- Enter the new name and click Save.
Where do I find my period sets?
The Periods dropdown in the top-left of your report shows your available period sets.
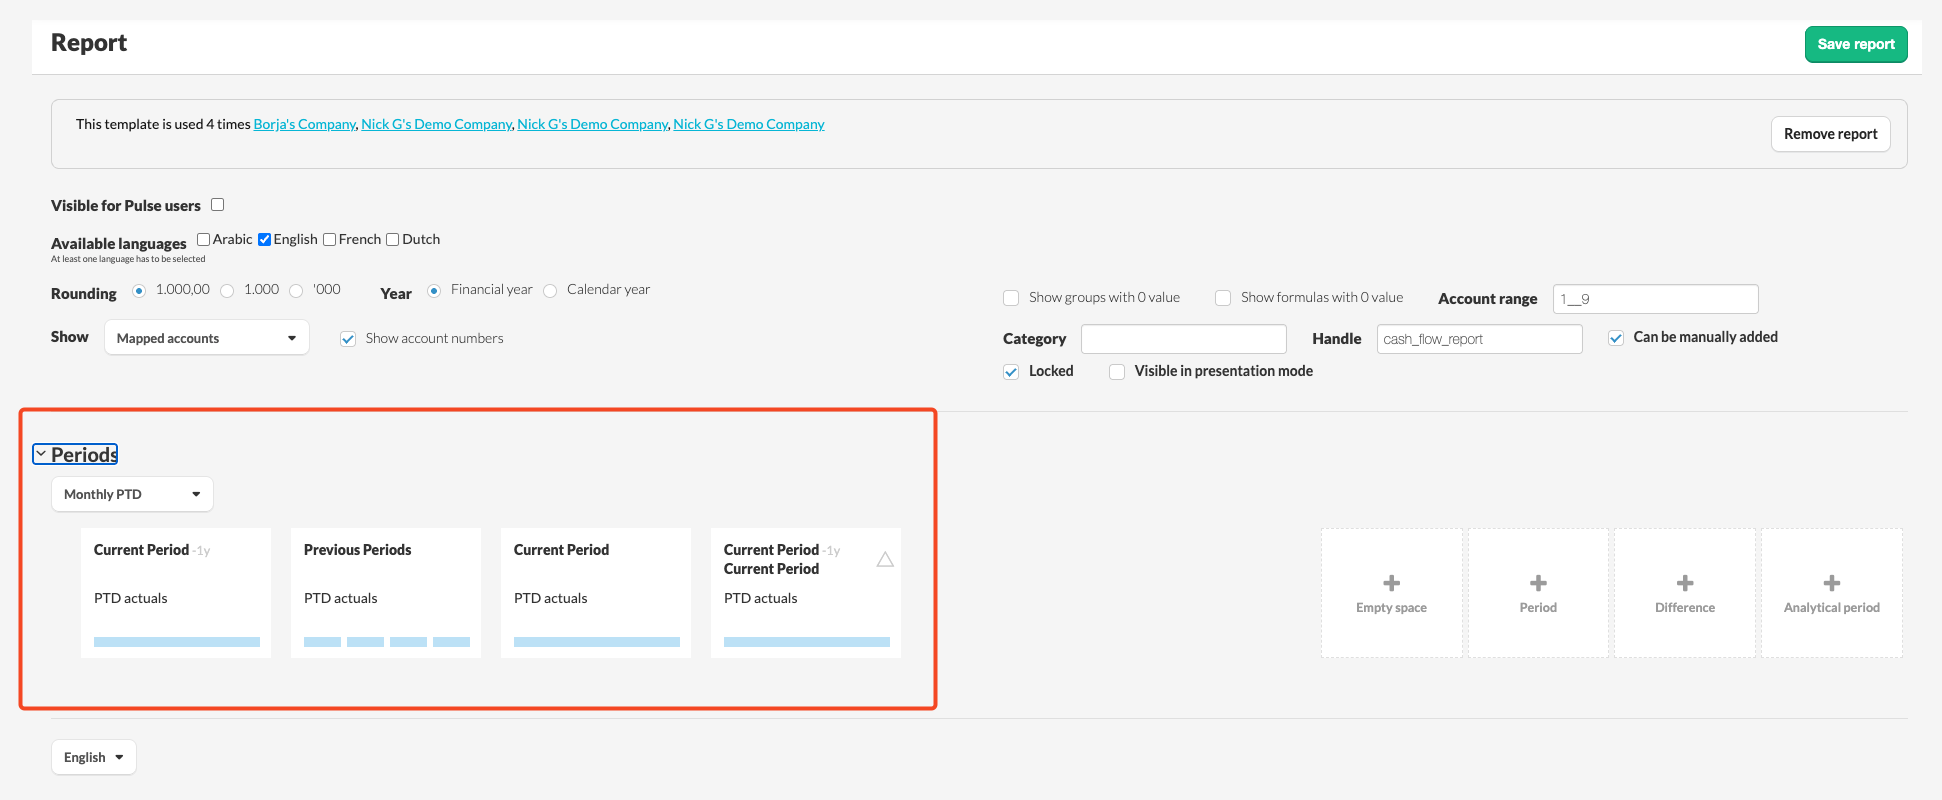
Period sets define the timeframes shown as columns in a report within a client file. They let you use the same report with different period configurations, so you do not need to create a separate report just to change the period columns.
How do I create period columns?
To build your period columns, drag the available blocks from the right-hand panel to the left.

- Empty space blocks improve report readability.
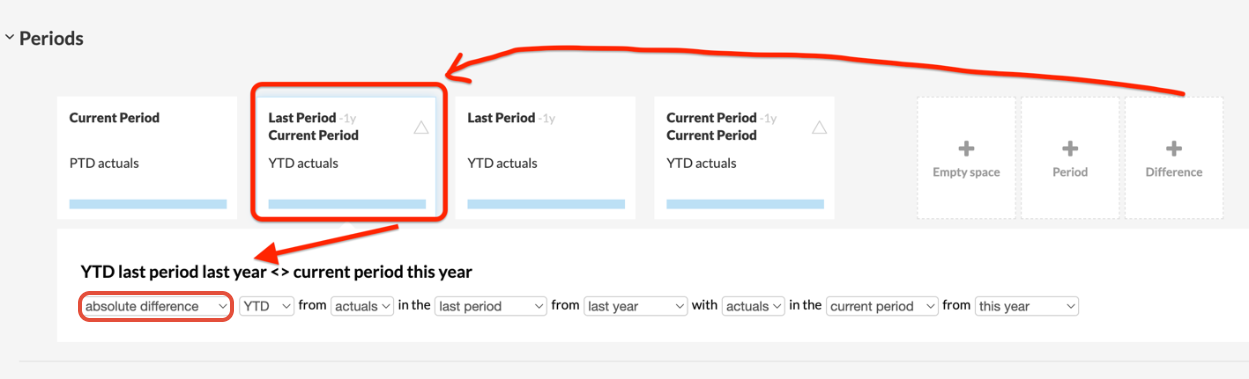
- Difference blocks calculate the difference between two periods in a single column.
See the How do I use difference periods? section below for more detail.
What are the different options in the period selection?
Dropdown 1
The first dropdown determines how Silverfin calculates the values in your period column. There are three options: YTD, PTD and RYTD.
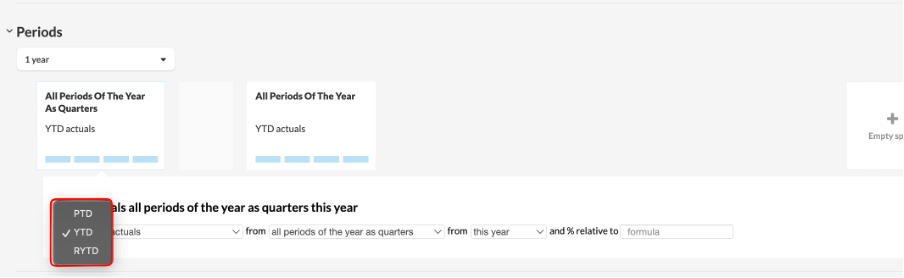
YTD - Year to Date
YTD shows a running cumulative total from the start of the financial year up to the current period.
Example: Viewing a report on 31 August shows all values accumulated from 1 January to 31 August of that year.
PTD - Period to Date
PTD shows the value for a single period. Silverfin calculates it by subtracting the previous period's cumulative total from the current period's cumulative total.
Example: If YTD for Q3 is 180 and YTD for Q2 is 150, the PTD for Q3 is 30.
RYTD - Relative Year to Date
RYTD is similar to PTD, but it takes into account the data for the entire year leading up to the current date, and it keeps rolling. This gives you a continuous, year-long picture of your data.
Example: Viewing a report in September 2023 shows data from September 2022 to September 2023. The following month, it shifts to cover October 2022 to October 2023, and so on.
For a detailed explanation of how YTD, PTD and RYTD are calculated, see How do I use PTD, YTD and RYTD in a report?
Dropdown 2
The second dropdown determines which data populates the period column.
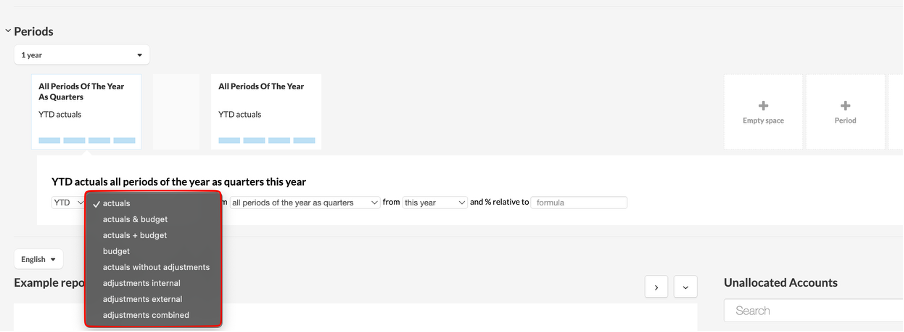
Actuals
Uses the actual data present in your file, either uploaded manually or synchronised from an integration.
Budget
Uses the budget values you have created in Silverfin to display projected figures in your report.
Actuals & Budget
Creates two columns, one showing actuals and one showing budget values. Use this option to compare real performance against your projections side by side.
Actuals + Budget
Displays actuals for periods that exist in your file, and switches to budget values for periods that do not yet exist. This option is designed for files with a higher reporting frequency, such as monthly reporting.
Example: If your 2026 file contains data up to June, this option shows actuals up to June and budget values from July onwards.
If a period exists but its actual value is zero, Silverfin displays zero, not the budget value. Budget values only appear for periods that do not yet exist in the file.
Adjustments
Displays the adjustments you have made in Silverfin. You can filter these by their internal or external tag.
Period display options
- Dropdown 3: which period or periods to display.
- Dropdown 4: which year to display them for.
Once you have selected your calculation method and data source, use dropdowns 3 and 4 to specify which periods to display, relative to the period you are currently viewing in the report.
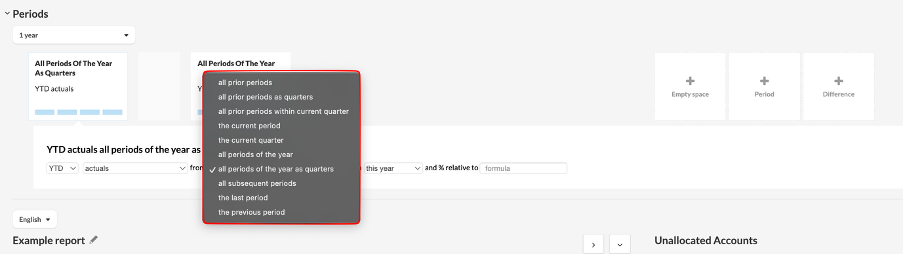
The following options are available:
- All prior periods: displays all periods before the period you are currently working in.
- All prior periods as quarters: for monthly files, this groups all previous periods into quarterly columns rather than showing one column per month. For example, January, February and March appear together as a single Q1 column.
- All previous periods within current quarter: for monthly files, this displays all previous months within the same quarter as the period you are currently working in.
- The current period: displays the period you are currently working in.
- The current quarter: for monthly files, this displays not just the current month but all three months that make up the quarter together.
- All periods of the year: displays all individual periods within the year. The periods shown depend on the file's reporting frequency: monthly, quarterly or yearly.
- All periods of the year as quarters: for monthly files, displays all individual periods within the year grouped into quarterly columns rather than one column per month.
- All subsequent periods: displays all periods after the period you are currently working in.
- The last period: displays the final period of the selected financial year. For example, for a quarterly file running from 01/01/2024 to 31/12/2024, this would show Q4 2024.
- The previous period: displays the period immediately before the one you are currently working in.
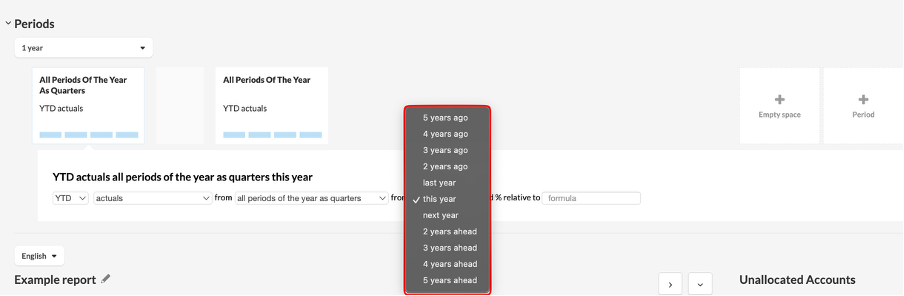
Year selection specifies which financial year to use when displaying the selected period. For example, you can choose to show the period for the previous year, the current year or the following year.
The reporting frequency of your file determines which period options are available to you. If your file is set to annual reporting, you cannot create period sets for quarters or months. Only files set to monthly reporting give you access to all three options: annual, quarterly and monthly.
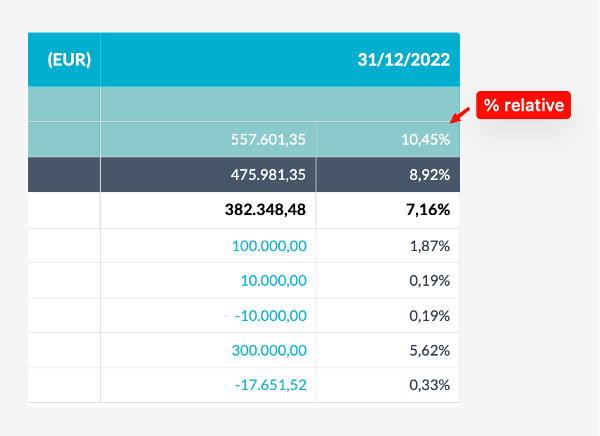
The % Relative option displays all values in a period column as a percentage of a chosen reference value, most commonly a formula or tag, such as total assets.

Example: each line item in the column displays as a percentage of the total assets value.

How do I use difference periods?
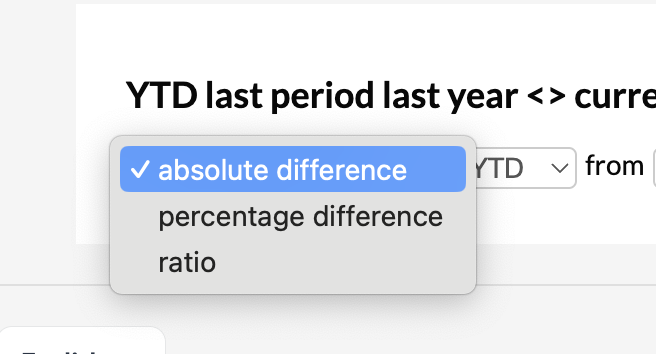
Difference periods calculate the variance between two period columns. You can choose from three calculation types:
- Absolute difference: the numerical difference between two periods.
- Percentage difference: the difference expressed as a percentage.
- Ratio: the proportional relationship between two periods.
All other dropdown options in a difference period follow the same logic as standard period columns.
Example: to show the absolute difference between last year and the current year, configure a difference block using both periods and select Absolute difference.
If you have questions about configuring period sets, contact the Silverfin support team or your Customer Success Manager.